


How to increase the efficiency of an Electric Vehicle Battery Charging System with Robust Design Capabilities of SaberRD?
The popularity of Electric Vehicles (EVs) has been expanding rapidly due to government subsidies, their increased range and lower battery costs, and environmental sensitivity.
Different energy storage systems configurations can be implemented for EVs. However, the electrochemical batteries still are the most used technology to store energy. To charge the battery, the power conversion process plays a vital role.
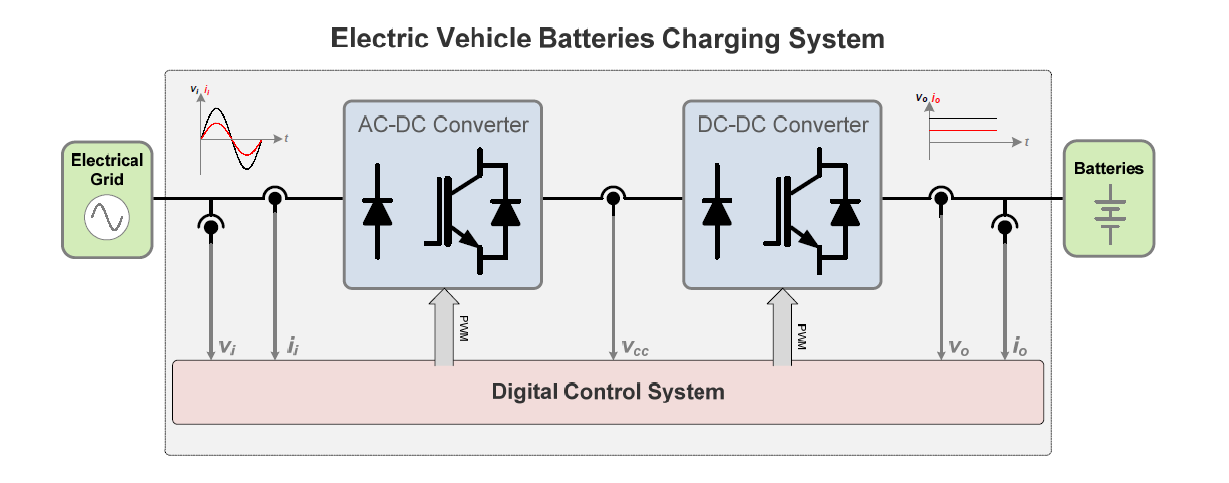
Fig. 1: Sample EV Batteries Charging System
EV battery charging systems are classified into three levels based on their power consumption and charging time. The level goes higher (1 to 3) as the charger transfers more power and charges the battery faster. Table 1 depicts more details of EV charging power levels.
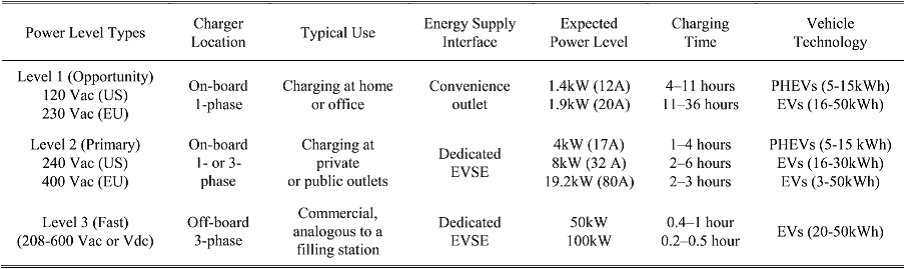
Table 1: Charging Power levels
The majority of EVs are designed with on-board unidirectional batteries charging systems. As shown in Table 2, the main criteria that differentiate the on-board and off-board are the implementation, the access, and the denomination.
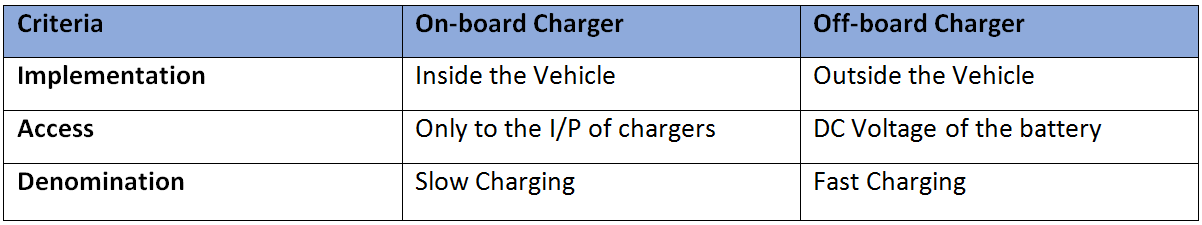
Table 2: Main differences between on-board and off-board chargers
SaberRD provides the unique and optimal solution for Designing, Modeling, Simulation, and Analysis of EV Battery Charging system. Now, we will discuss the solution provided by SaberRD for optimizing battery charger designs using example of Level 2 On-board 3.3kW EV Battery Charging system.
Circuit & System Design:
As shown in Fig 2, Li-ion 24 kWh 32.5Ah battery is charged from single phase 230 V 50Hz AC supply. The AC voltage from the electric grid is passed to full bridge diode rectifier to convert AC voltage to DC. The rectified AC voltage is converted to 400V DC voltage using interleaved boost converter. Power Factor Correction (PFC) controller is used to make the power factor close to unity that further improves the input power quality.
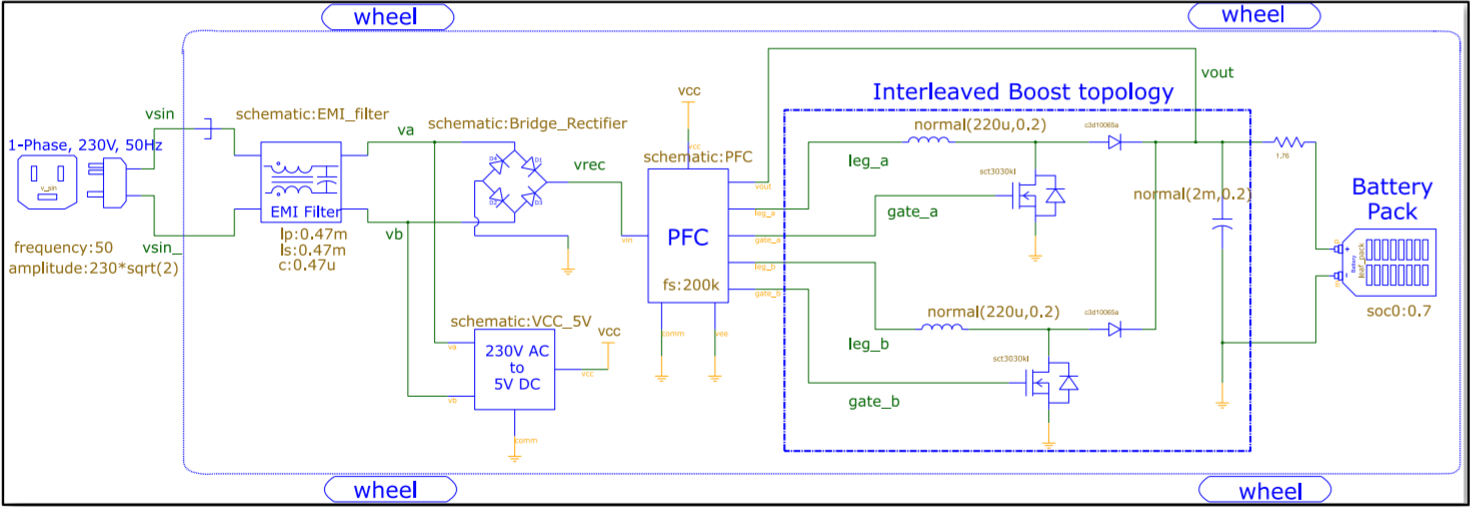
Fig. 2: Schematic of a Level-2 on-board 3.3kW EV Battery Charging System
Modelling capabilities of SaberRD
SaberRD addresses the real-world modeling challenges with its characterization tools. Diode, power MOSFET and Battery characterization tools are used in this design.
Li-ion Battery Modelling
Characterization of a Li-ion battery is done based on the charge and the discharge curves from the datasheet of AESC 32.5 Ah battery. The Battery tool provides built-in optimizer to match the model curves with datasheet or measured curves. There is a built-in test bench for validating the charge and the discharge characteristics of the battery model generated.
The model is a high-level physical behavior model that embraces various electrochemistry attributes and can be characterized at multiple temperatures. Statistical variability can also be specified for a Monte Carlo analysis. Several different types of battery topologies ranging from a basic component cell to any pack configurations can be generated from the Battery tool.
MOSFET Modelling:
N-Channel Silicon Carbide (SiC) MOSFET SCT3030KL is characterized and used in this design.
The manufacturer’s datasheet curves such as the output and the transfer characteristics, the capacitance and the gate charge curve are used for characterization. There is a built-in optimizer to match the model curves with the datasheet or the measured curves.
Diode Modelling:
The SiC Schottky diode C3D10065A is used as boost diode in this design.
The Forward characteristic and the capacitance curve from manufacturer’s datasheet are used for characterization. The Diode tool supports the Silicon and the Silicon Carbide technologies. The Thermal impedance and the Stress ratings are also modeled.
Simulation & Analysis
Time domain (Transient) analysis is performed to verify the nominal behavior of the design. The Input voltage and current, battery current, and output voltages are plotted, as shown in Fig. 3.
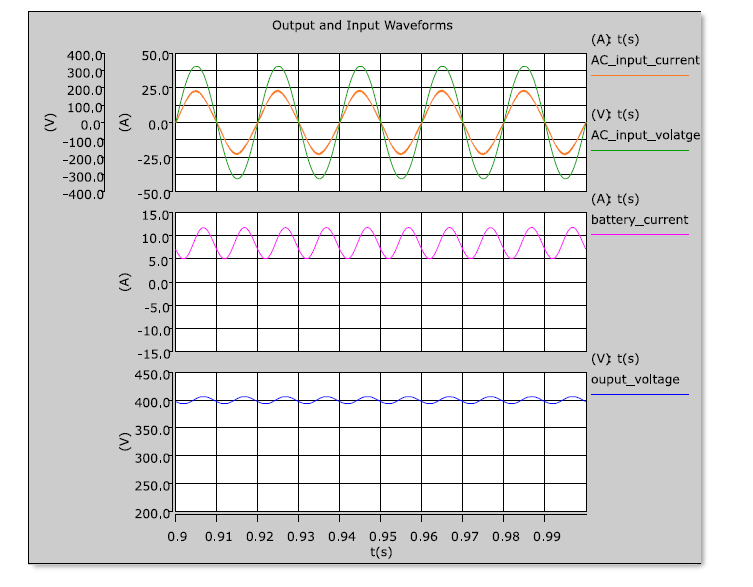
Fig. 3: Output and Input waveforms
Experiment Analyzer:
In SaberRD, the Experiment Analyzer tool supports the implementation of the complex robust design methodologies and improves the design simulation productivity through automation of analyses. The tool includes an intuitive user interface for building complex experiments.
With the help of Experiment result, it is observed that the efficiency is 94.425% (See Fig. 4: Experiment Report).
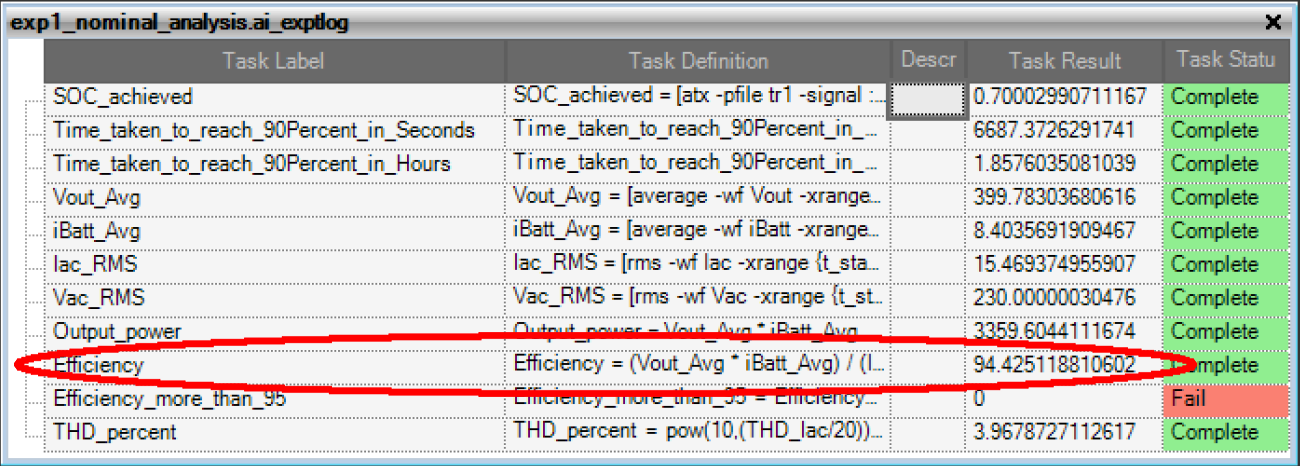
Fig. 4: Experiment Report
Methods to Improve Circuit Efficiency:
Flow-based methodology is used for this design optimization. To improve the circuit efficiency, follow the steps below:
- Perform Sensitivity Analysis
Sensitivity analysis in SaberRD is used to identify the design parameters that have biggest impact on the design performance. It ranks the parameters by their impact on design performance and generates a sensitivity report. The sensitivity analysis is performed to identify the most influencing parameters to improve the efficiency in the design.
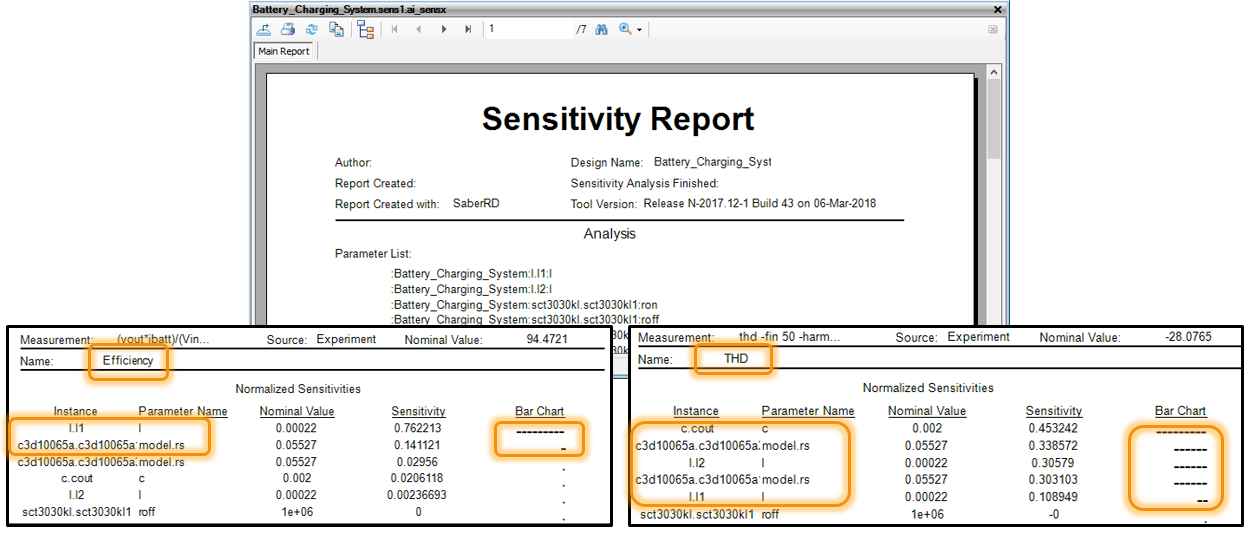
Fig. 5: Sensitivity Report
In Fig. 5, it is observed that the boost inductor and series resistance of boost diode have the most influence on the efficiency. Also, boost inductance and output capacitance along with series resistance of boost diode are sensitive towards THD measurement on input current.
- Reduce Losses
Silicon Carbide (SiC) Schottky diodes are known to have high forward voltage drop for example, 2.1 to 2.5 V. For investigation purpose, the SiC Schottky diodes are replaced with different part number (STPSC20065) that has lower forward voltage drop. Forward voltage drop of STPSC20065 Schottky diode is 1.3V.
Replacing the diode improved the efficiency from 94.43 % to 94.46 %.
- Use Worst Case Analysis tool
The parameters of passive element identified in Sensitivity analysis are provided with probability distribution and they are loaded in the WCA tool in SaberRD.
WCA uses multiple algorithms to find best fit value for the parameter to obtain optimum efficiency. With the test bench, those values are identified and passed to the active simulation session and Transient analysis is performed again. After successful completion of simulation, the efficiency is now improved to 95.08% as shown in Fig. 6. Also, the THD measurement on input current is 4.35% and is within the limit specified.
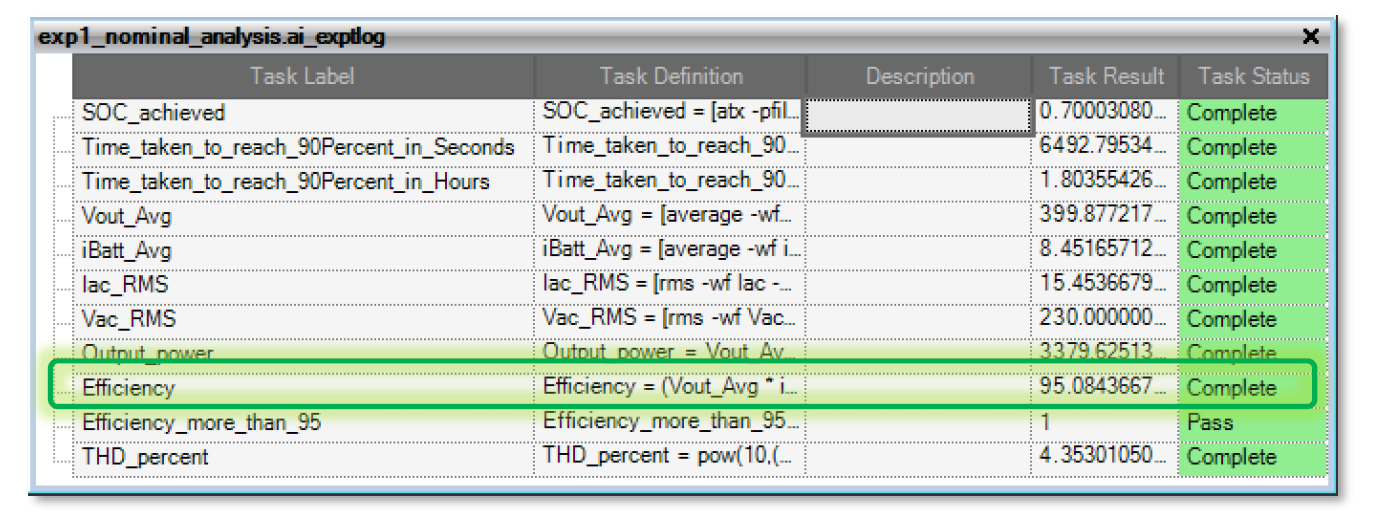
Fig. 6: Experiment Report after exporting results from WCA
Level-2 type on-board 3.3kW EV battery charging system is designed in SaberRD. Nominal behavior of the design is simulated and the system efficiency is obtained as 94.42%.
With the help of sensitivity analysis and WCA tool, the efficiency is improved to 95%.
References:
- Saber Forum Example on Level 2 on-board 3.3kW Batter Charger for EV
- SAE International webinar, “Electric Vehicles: Is your battery charger design performing at optimal efficiency?”
- Vítor Monteiro, Henrique Gonçalves, João C. Ferreira and João L. Afonso, “Batteries Charging Systems for Electric and Plug-In Hybrid Electric Vehicles,” Chapter 5