Reducing vehicle interior noise is one of the main challenges automotive engineers face because acoustic comfort directly impacts sales and customer loyalty. While great progress has been made to reduce road and tire noise, wind noise remains a major concern for vehicles travelling at high speeds and for electric vehicles. This case study shows how ProLB is used by major car manufacturers to minimize aerodynamically-generated noise sources.
Goal of the analysis
For a vehicle travelling at highway speeds, the main source of aerodynamically-generated noise is the turbulent flow structures impinging on the windshield and the side-windows. These structures, generated by external geometric features of the car (mirror assembly, A-pillar, wiper system…), produce an unsteady excitation force as well as an acoustic field acting on the different panels.
This case study presents an accurate prediction of the flow-induced unsteady excitation force applied to a car’s side window. The simulation accounts for the full-scale 3D vehicle geometry. The results of such simulation are used to optimize the side mirrors’ shapes, thus reducing the noise transmitted inside the cabin.
Simulation workflow
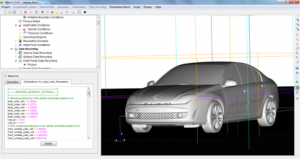
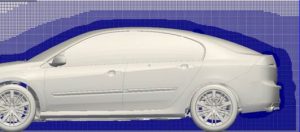
A template is provided allowing engineers to reduce the time required to setup the simulation to less than an hour. The simulation is then run using LBSolver on a HPC cluster. The fluid volume is discretized following the user-defined grid refinement regions. The time required to generate the volume mesh is substantially reduced thanks to the parallel and automatic octree mesher. Turbulence modeling is based on a Large-Eddy Simulation approach. It is coupled with a pressure gradient-sensitive wall-law which integrates a correction for the viscous sub-layer as well.
Figure 1: left – Simulation setup and template in LBpre, the user-interface of ProLB. The figure shows a Renault Laguna as well as the refinement regions used to define mesh refinement around the car. Right: a slice of the volume mesh surrounding the car.
Simulation results:
The results of the simulation are analyzed from an aerodynamic as well as an aeroacoustic perspective.
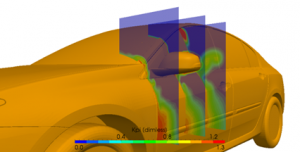
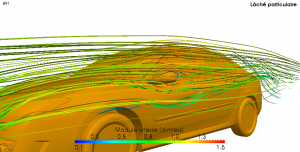
On the aerodynamic side, the flow is analyzed in the vicinity of the side mirror, cf. Figure 2.
Figure 2: left – Total pressure loss in the vicinity of the side mirror. Right: a streamlines colored with velocity close to the A-pillar and the side-mirror.
Three types of aeroacoustic analysis are performed:
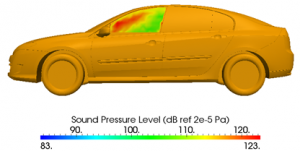
- An Overall Sound-Pressure Level map on the surface of the side window, which allows locating the maximum excitation zones (Figure 3)
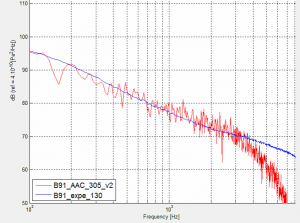
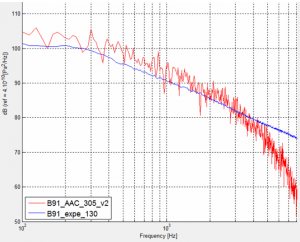
- Comparison between the computed and measured PSD of pressure on specific probes (Figure 4)
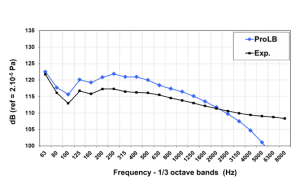
- Comparison between the computed and measured spatially averaged PSD of pressure on the side-window’s surface. (Figure 5)
The comparison between the simulation and measurments shows a satisfactory correlation.


